Browsing Tag: Infographics

Remote Year

Losing at Translations

I’m three months into living in Spanish-speaking countries, and I really thought that by now I’d be speaking more Español than I have been. The challenge of living, traveling and working alongside 50+ native/fluent English speakers is that it’s really hard to break out of my language comfort zone. When circumstances do call for speaking Spanish, there’s almost always someone…

Continue reading
Remote Year

#IkigaiOrDie

The Oxford English dictionary begins the definition for community as “a group of people living in the same place,” and continues with variations on that theme of place: a particular area of place considered with its inhabitants a body of nations or states the people of a distinct countryBut when countries and places constantly change, a different sense of community forms, a community based on common…

Continue reading
Remote Year, Unraveled

Leaving Lisbon with a Little Level 3 Fun

Back at the beginning of August during our initial Remote Year orientation in Lisbon, our program leaders introduced a philosophy the company has termed “Level 3 Fun” that is totally in the spirit of Unraveled Travels. The concept classifies “fun” into three different levels:  Level 1 FunEveryday activities you find simple pleasure in. Level 1 Fun is Sunday morning coffee and crossword puzzles. Happy…

Continue reading
Infographics, Photo Gallery, Remote Year

Remotely Interesting

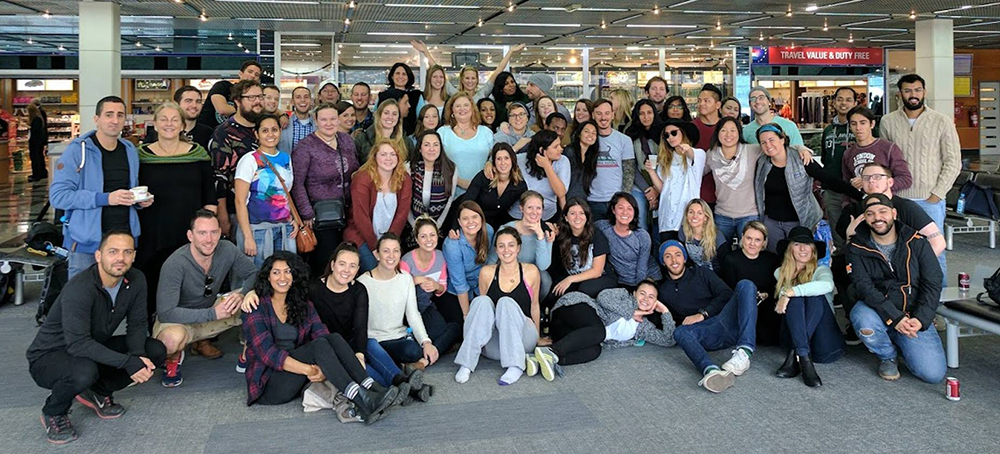
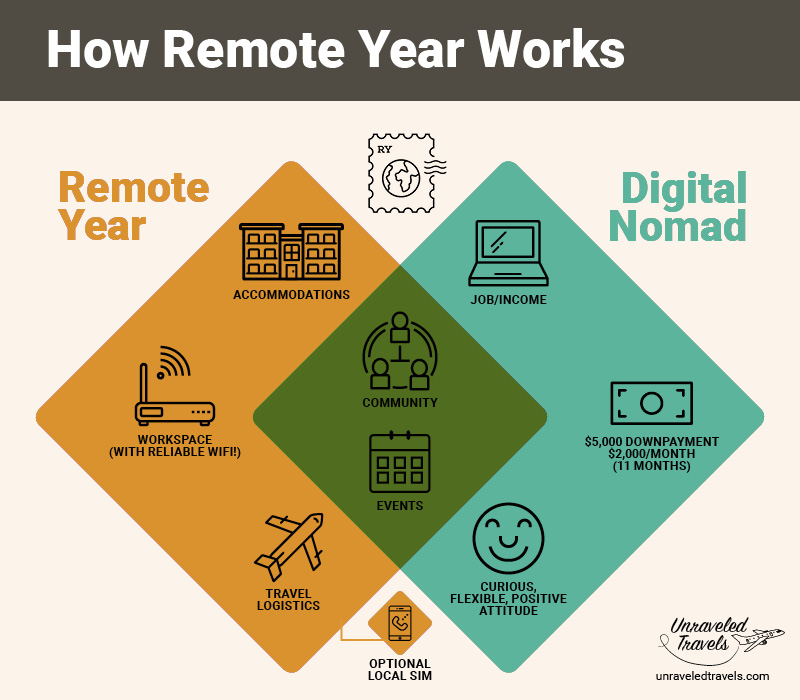
Wow. What a month and a half. On July 31, I arrived in Lisbon, Portugal to kick off a year of traveling, working, living, adventuring, and generally badassing around the world with Remote Year, which I’ve been describing as an international mobile coworking program. Every month for a year, 75(ish) of us “digital nomads” move together to a new foreign city where we live, work…

Continue reading